Authors: Dr. Shibu Gupta; Dr. Beatrice Schär
Securecell AG/ETH Wyss Zurich: Liver4Life group, October 2020
Keywords: Seraccess®, APDS, blood dilution, in vitro experiment
Introduction
Project milestone 3 is to evaluate the long-term sampling and dilution of blood using the in-house developed catheter and a specific dilution process. This testing has been performed at ETH Zurich in collaboration with Wyss Zurich. The insights gained from this project will be implemented in the context of catheter development and the automated dilution process.
Catheter
Our unique catheter with three lumens allows us to pick up a small blood sample (25 μl) every 5 minutes from the continuously regulated blood system provided by Wyss Zurich and to simultaneously dilute the blood with physiological solution. The synchronized process is carried out by a device connected to the catheter, the SeraDilutor.
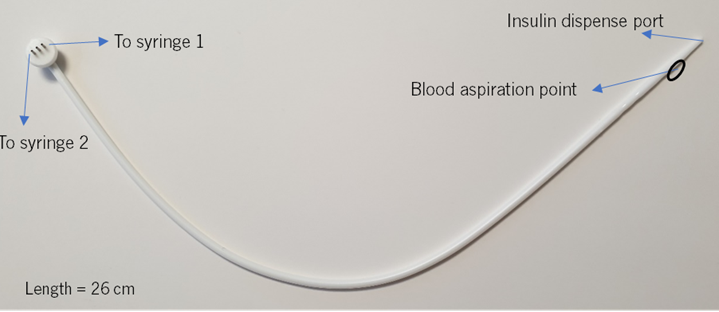
In-house developed catheter
Process
The blood sample is diluted in the catheter on the way to the SeraDilutor and is collected into a 250 µL syringe. The diluted blood can be collected on a scale (for reproducibility) or in test tubes to extract plasma and measure glucose concentration using a Cobas photometer (for accuracy). The automatic dilution method was, thus, compared with manual blood dilution.
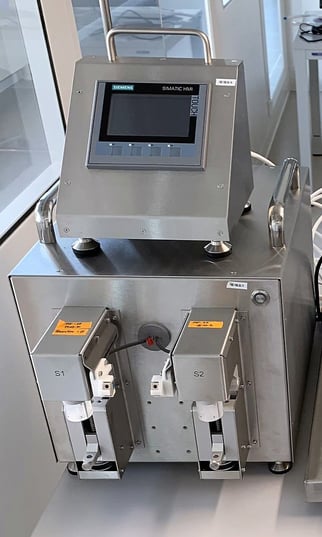
SeraDilutor
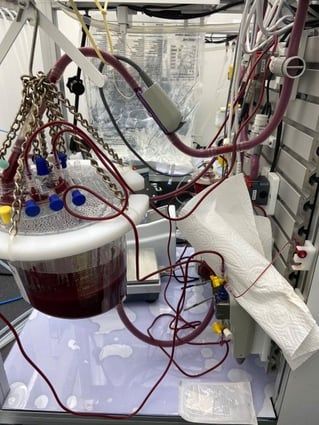
Regulated blood system
Methods and Results
The trial was conducted in October 2020 at ETH in collaboration with the Liver4Life group (Wyss Zurich). During the two-week trial, two types of data were recorded:
- Weight of each automatically diluted blood sample (every 5 minutes) was recorded on a scale by Lucullus® and analyzed for reproducibility. The coefficient of variation (CV), a measure for reproducibility, for ~2000 dilutions was 1.0%.
- Each day, the SeraDilutor performed 36 automatic blood dilutions. A manual dilution was performed for each automatic dilution to serve as a control. The agreement between automatic and manual dilution was then evaluated using tolerance interval analysis based on the glucose concentrations measured in these diluted samples. This plot demonstrates strong agreement in glucose concentrations following automatic vs. manual dilution. We can say with high confidence that 95% of data points will lie within our tolerance interval of - 4.75% to 3.88%.
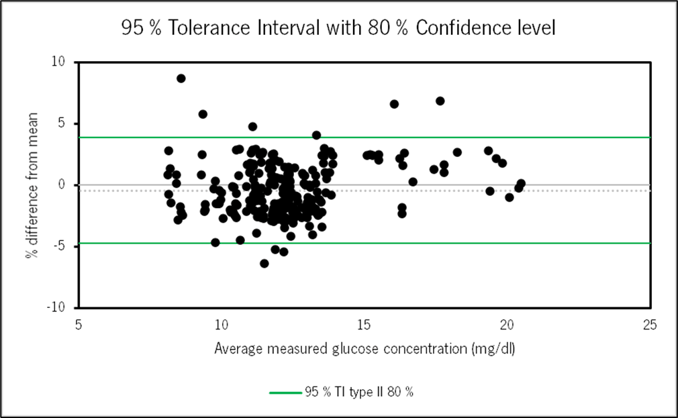
Comparison: automatic vs. manual dilution
|
Milestone 3 was completed successfully. The long-term blood dilution process using the catheter was tested for the first time, and a very good reproducibility of dilution was achieved over two weeks of accelerated testing. These two weeks correspond to six weeks of practical usage as we sampled every 5 minutes instead of every 15 minutes as planned for the APDS. Very importantly, the method comparison demonstrated strong agreement between automatic dilution (catheter, process) and the reference manual dilution method. |


